

EXPAND ALL
- Home
- About Pixie
- Installing Pixie
- Using Pixie
- Tutorials
- Reference

Debugging distributed messaging systems can be challenging. Pixie makes analyzing Kafka easier by using eBPF to automatically capture full-body Kafka requests without the need for manual instrumentation.
This tutorial will demonstrate how to use Pixie to see:
You will need a Kubernetes cluster with Pixie installed. If you do not have a cluster, you can create a minikube cluster and install Pixie using one of our install guides.
You will need to install the Kafka microservices demo application:
- Install the Pixie CLI.
- Run
px demo deploy px-kafkato install the demo app.- Run
kubectl get pods -n px-kafkato make sure all pods are ready before proceeding.- Run
px demo interact px-kafkaand follow the directions to turn on the invoicing service delay.
The demo application deployed in the Prerequisites section has three microservices that use Kafka to communicate:
order service creates orders. This service publishes messages to the order topic.shipping service consumes the order topic messages and extracts the information needed to ship the items. This service is able to consume the order topic messages at the rate they are produced.invoicing service consumes the order topic messages and extracts the information needed to send out an invoice. This service, when configured with the delay in the Prereqs step, is slower and unable to consume the order topic messages at the rate they are produced.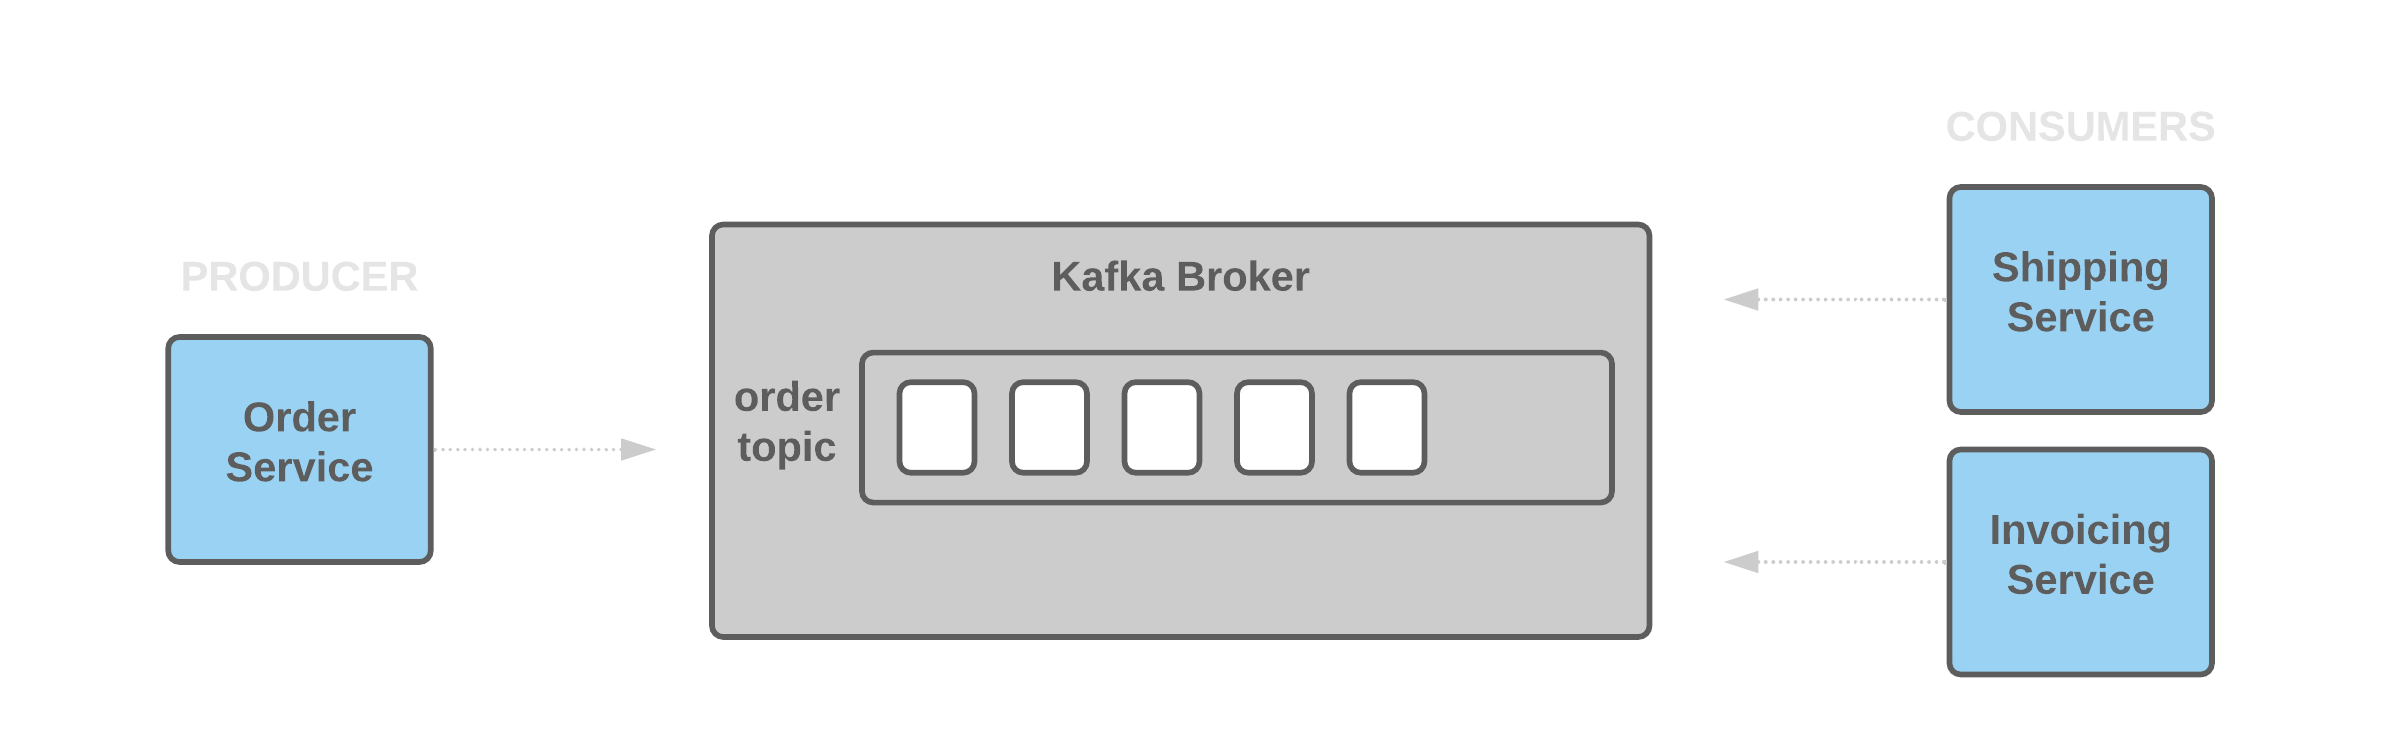
To see the application's simple front end, navigate to the external IP (and port) of the apache service:
kubectl -n px-kafka get svc apache
The application has 3 pages: one each for the order, shipping and invoicing services. A load generator simulates a user adding orders to the Order page. Orders can also be manually entered by scrolling to the bottom of the Order page and selecting the "Add Order" button. Any orders added on the Order page should soon show up on both the Shipping and Invoicing pages.
Let's use Pixie to see a graph of producers and consumers for each Kafka topic.
Select px/kafka_overview from the script drop-down menu.
Select the drop-down arrow next to the namespace argument, type px-kafka, and press Enter to re-run the script.
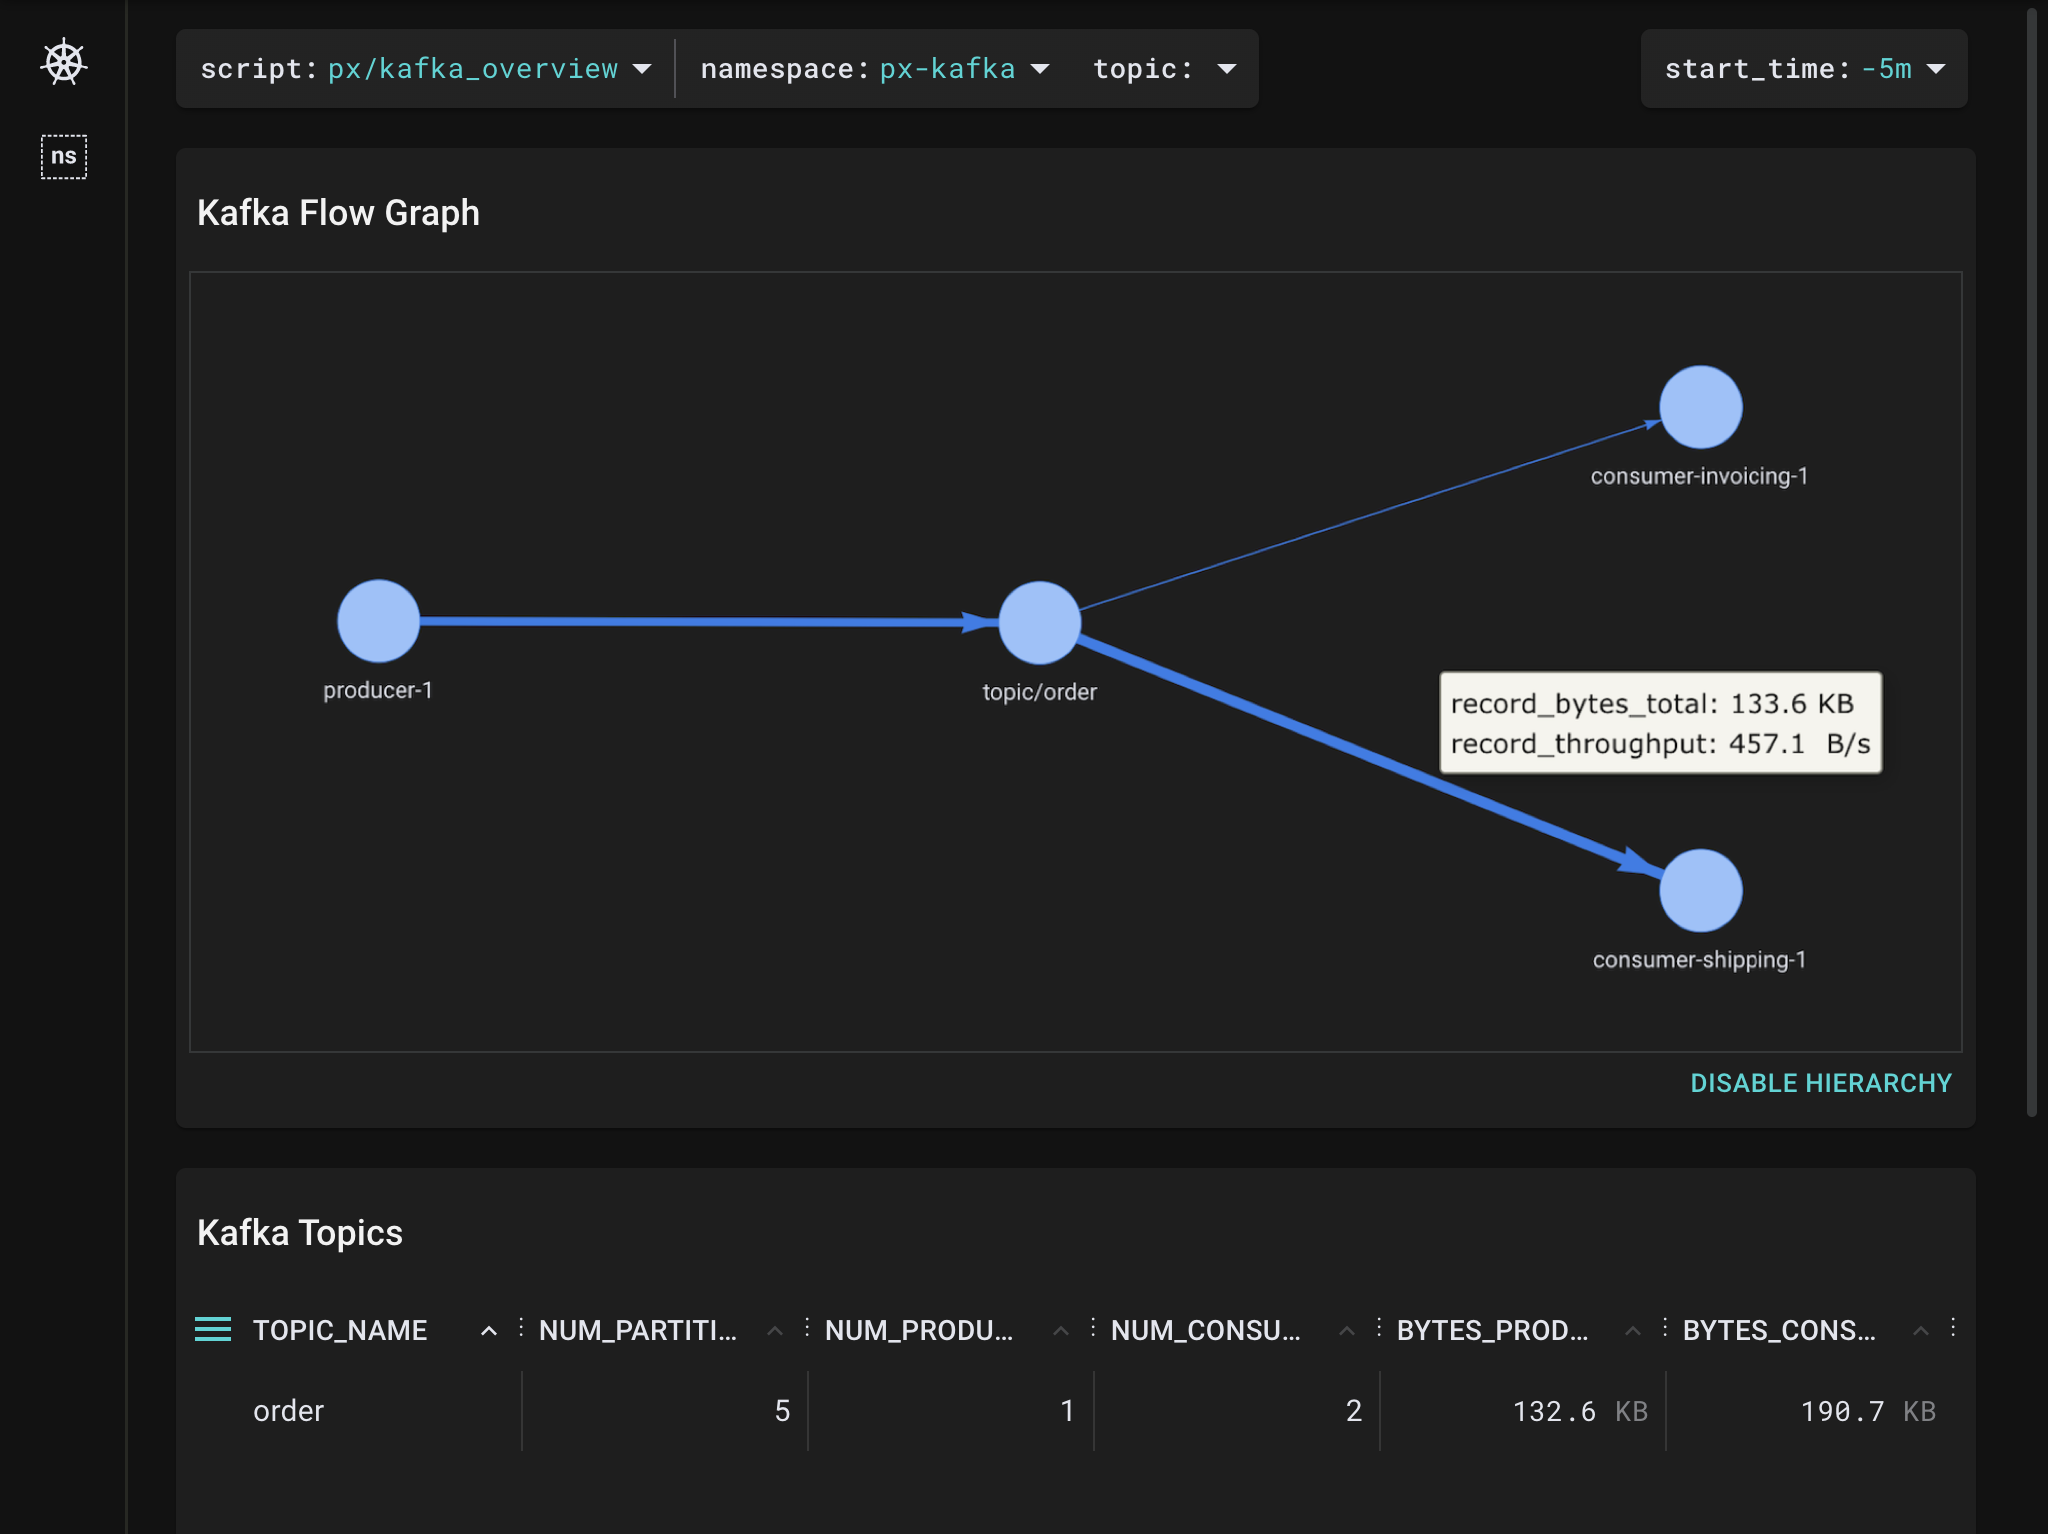
Pixie is able to automatically discover and list all clients and topics in the cluster.
This graph shows us that our microservice app has 1 active topic, named
order, with 1 producer and 2 consumers.
By examining the edges of the graph, we can see that the producer is producing to the order topic at about
450 B/s. Theshippingclient is consuming at the same rate of450 B/s. Theinvoicingclient is only consuming at200 B/sand is falling behind. Since this is a demo application, the traffic throughput is lower than what you'd typically see in a production application.
The Kafka Topics table below the graph summarizes the same high-level topic information, and also includes the number of topic partitions.
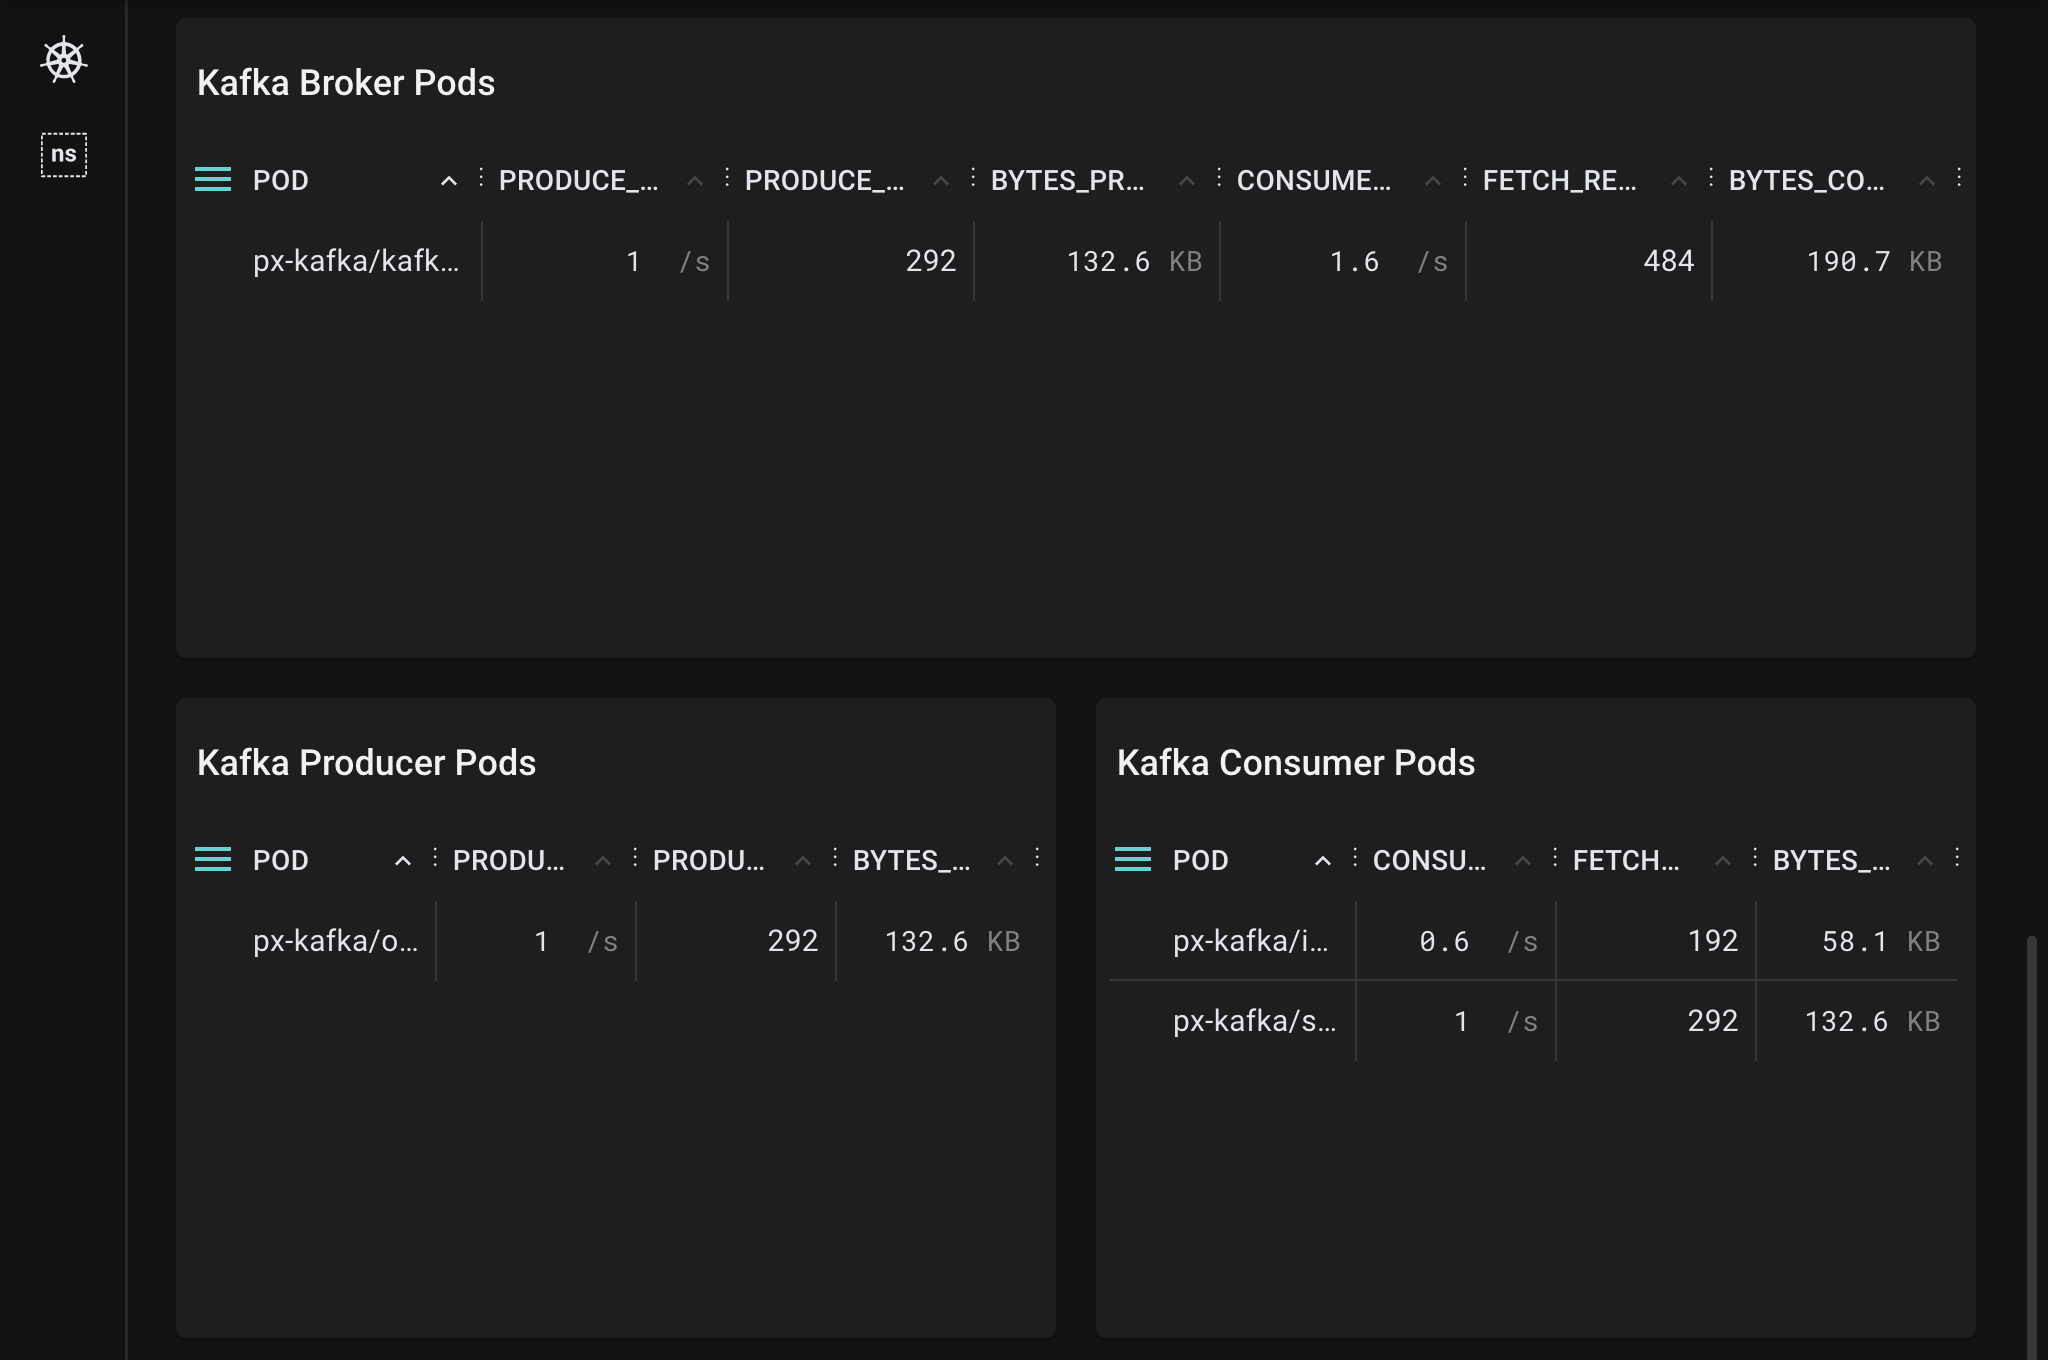
The Kafka Producer Pods and Kafka Consumer Pods tables confirm that the
invoicingclient is consuming messages at a slower speed than they are being produced.
In our case, the
shippingclient has sent 292Fetchrequests while theinvoicingclient has sent much fewer (only 192Fetchrequests). This again indicates that something is wrong.
When debugging Kafka problems, you may want to check the health of the clients involved. Pixie makes it easy to switch between higher-level Kafka system metrics and the lower-level client infra metrics.
invoicing client, click on the px-kafka/invoicing-* pod name in the POD column of the Kafka Consumer Pods table.Clicking on any pod name will take you to the
px/podscript for that pod. This script shows an overview of the pod's CPU usage, network traffic and throughput, disk, and memory usage.
In this case, CPU utilization is low, which means resource starvation is not causing the
invoicingclient to consume messages at a slower rate.
Let's inspect the raw Kafka requests flowing through the cluster.
px/kafka_data from the script drop-down menu.Pixie automatically traces all messages flowing through your cluster, identifies the ones using the Kafka protocol, and parses the message metadata. This script shows a sample of the most recent Kafka events in the cluster.
For each record you can see the source, destination, request command, request and response, and the latency. Note that Pixie only shows the size of the payload, not the content, because it's usually too large.
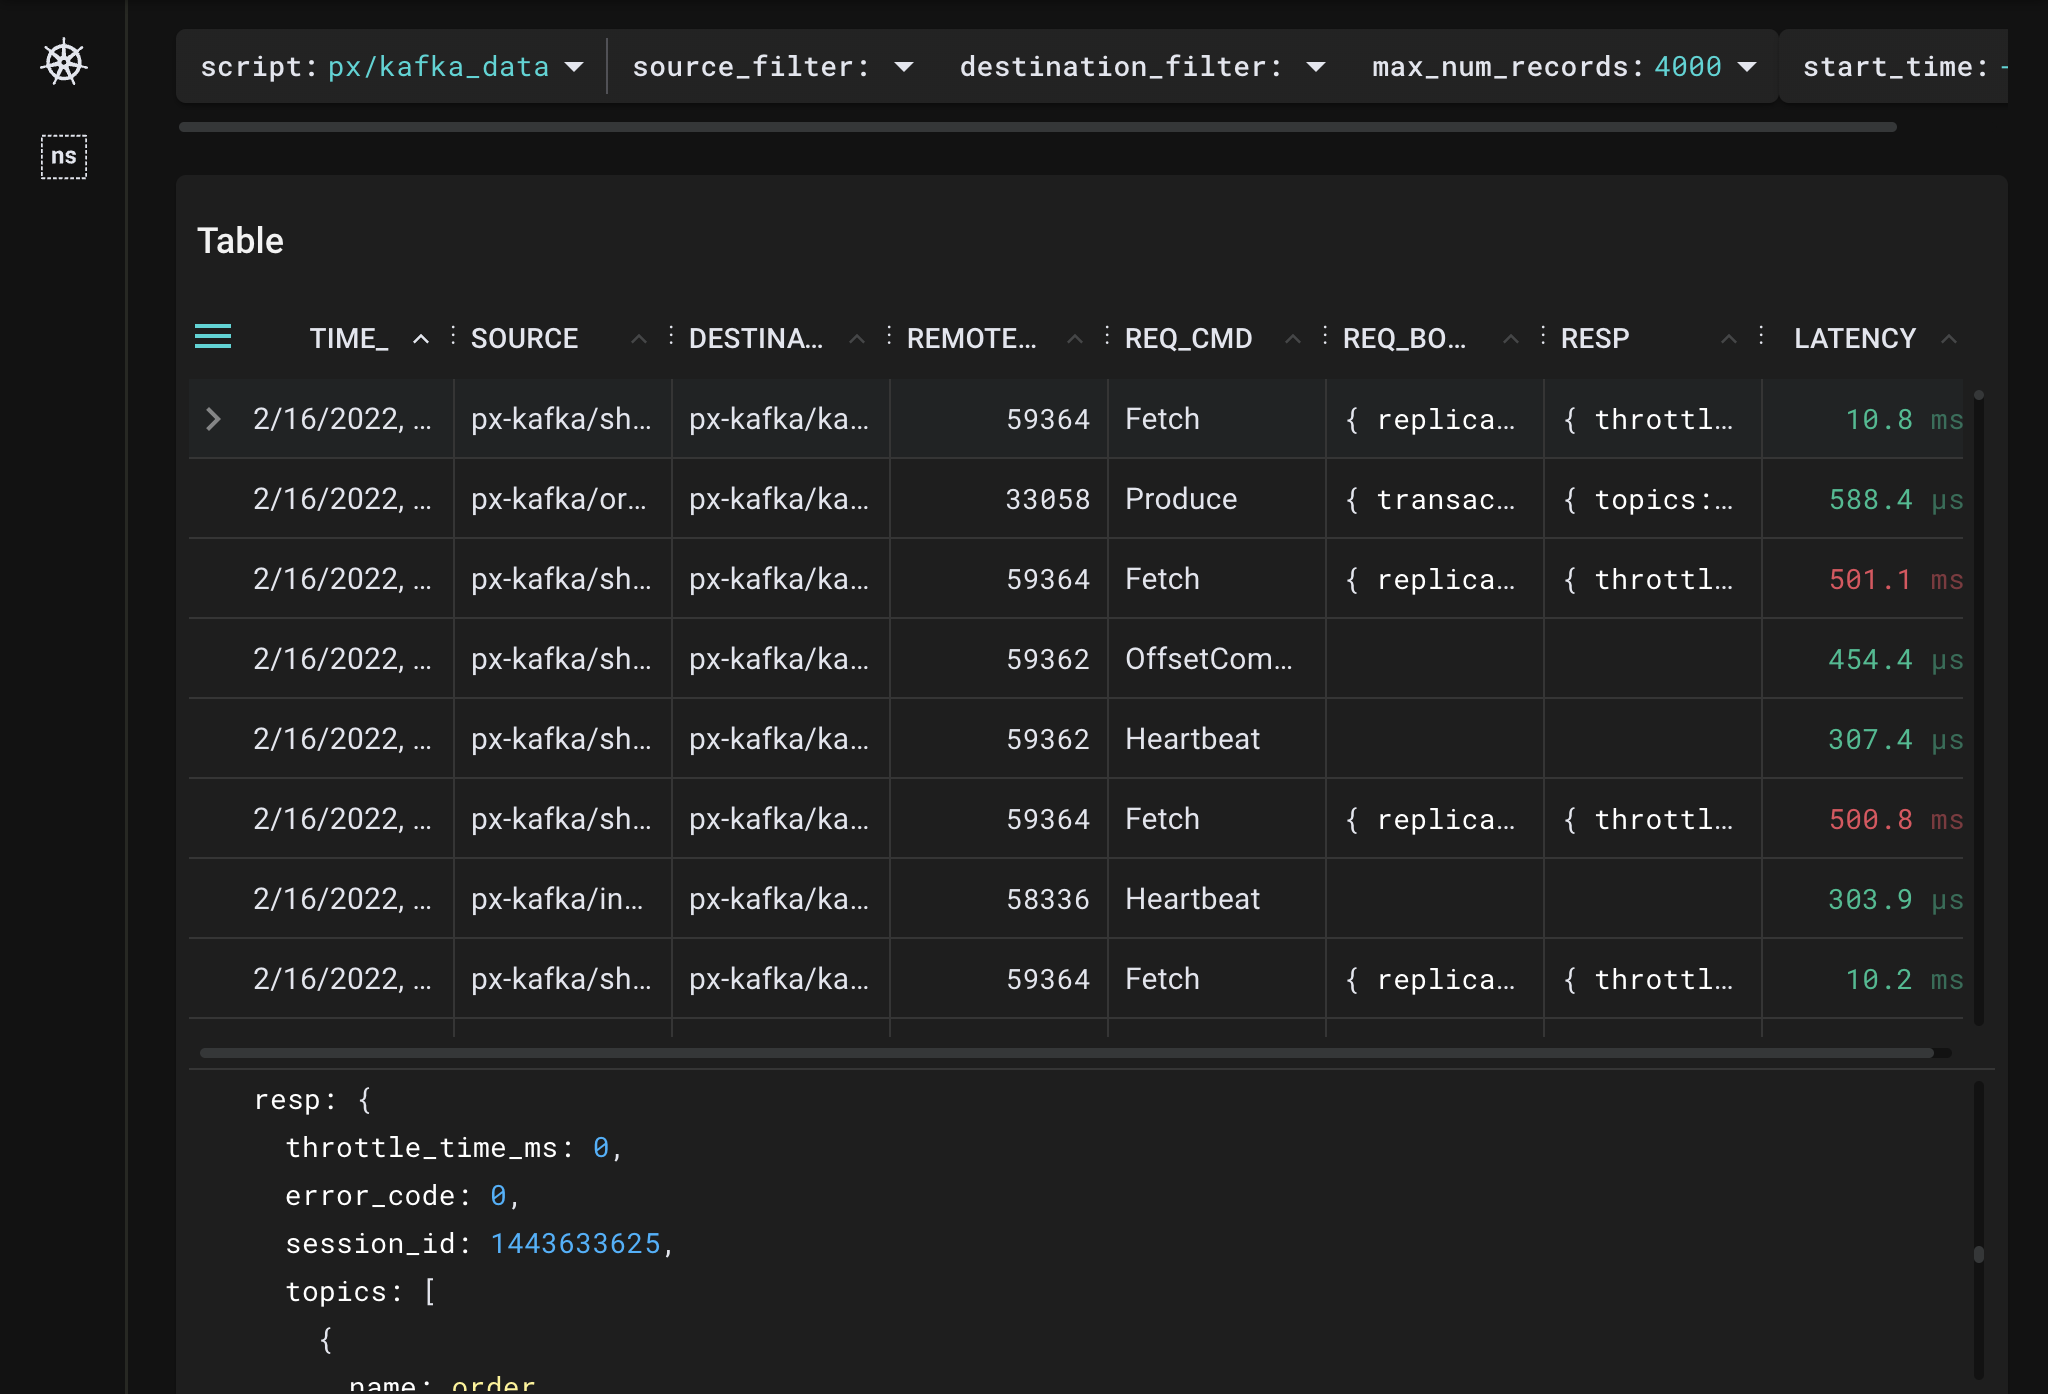
TIME_ column title to sort by time.We can see that there are multiple Kafka request commands being traced by Pixie, such as
Produce,Fetch,OffsetCommit, andHeartbeat.
Produce REQ_CMD to inspect the parsed request and response body in JSON format.Pixie parses the request body and gives us information on the name of the topic, what partition it is producing to and the total size of the message set. Inspecting the response shows us if there's any error code coming back from the Kafka broker, base offset, log append time, etc.
This script is useful for inspecting a specific request or filtering all requests by a certain command (you'll need to edit the PxL script to do that).
Producer consumer latency is the time between when a producer pushes a message to a topic to when it is fetched by a consumer. This latency is important to monitor because many incidents begin with consumer lag.
A large consumer lag in one component can mean that it is out of sync with other components. In our demo application, the invoicing service is not consuming messages from the order topic as quickly as the shipping service is. If you check the application front-end, you will see orders on the Shipping page that are not present on the Invoicing page. If not addressed, this application may fail to create invoices for all of the orders it receives and lose out on money owed for the orders that successfully shipped.
Select px/kafka_producer_consumer_latency from the script drop-down menu.
Select the drop-down arrow next to the namespace argument, type px-kafka, and press Enter to re-run the script.
The Kafka Topics table will update to show the topics being written and read to by clients in this namespace. The table lists our single
ordertopic.
topic argument, type order, and press Enter to re-run the script.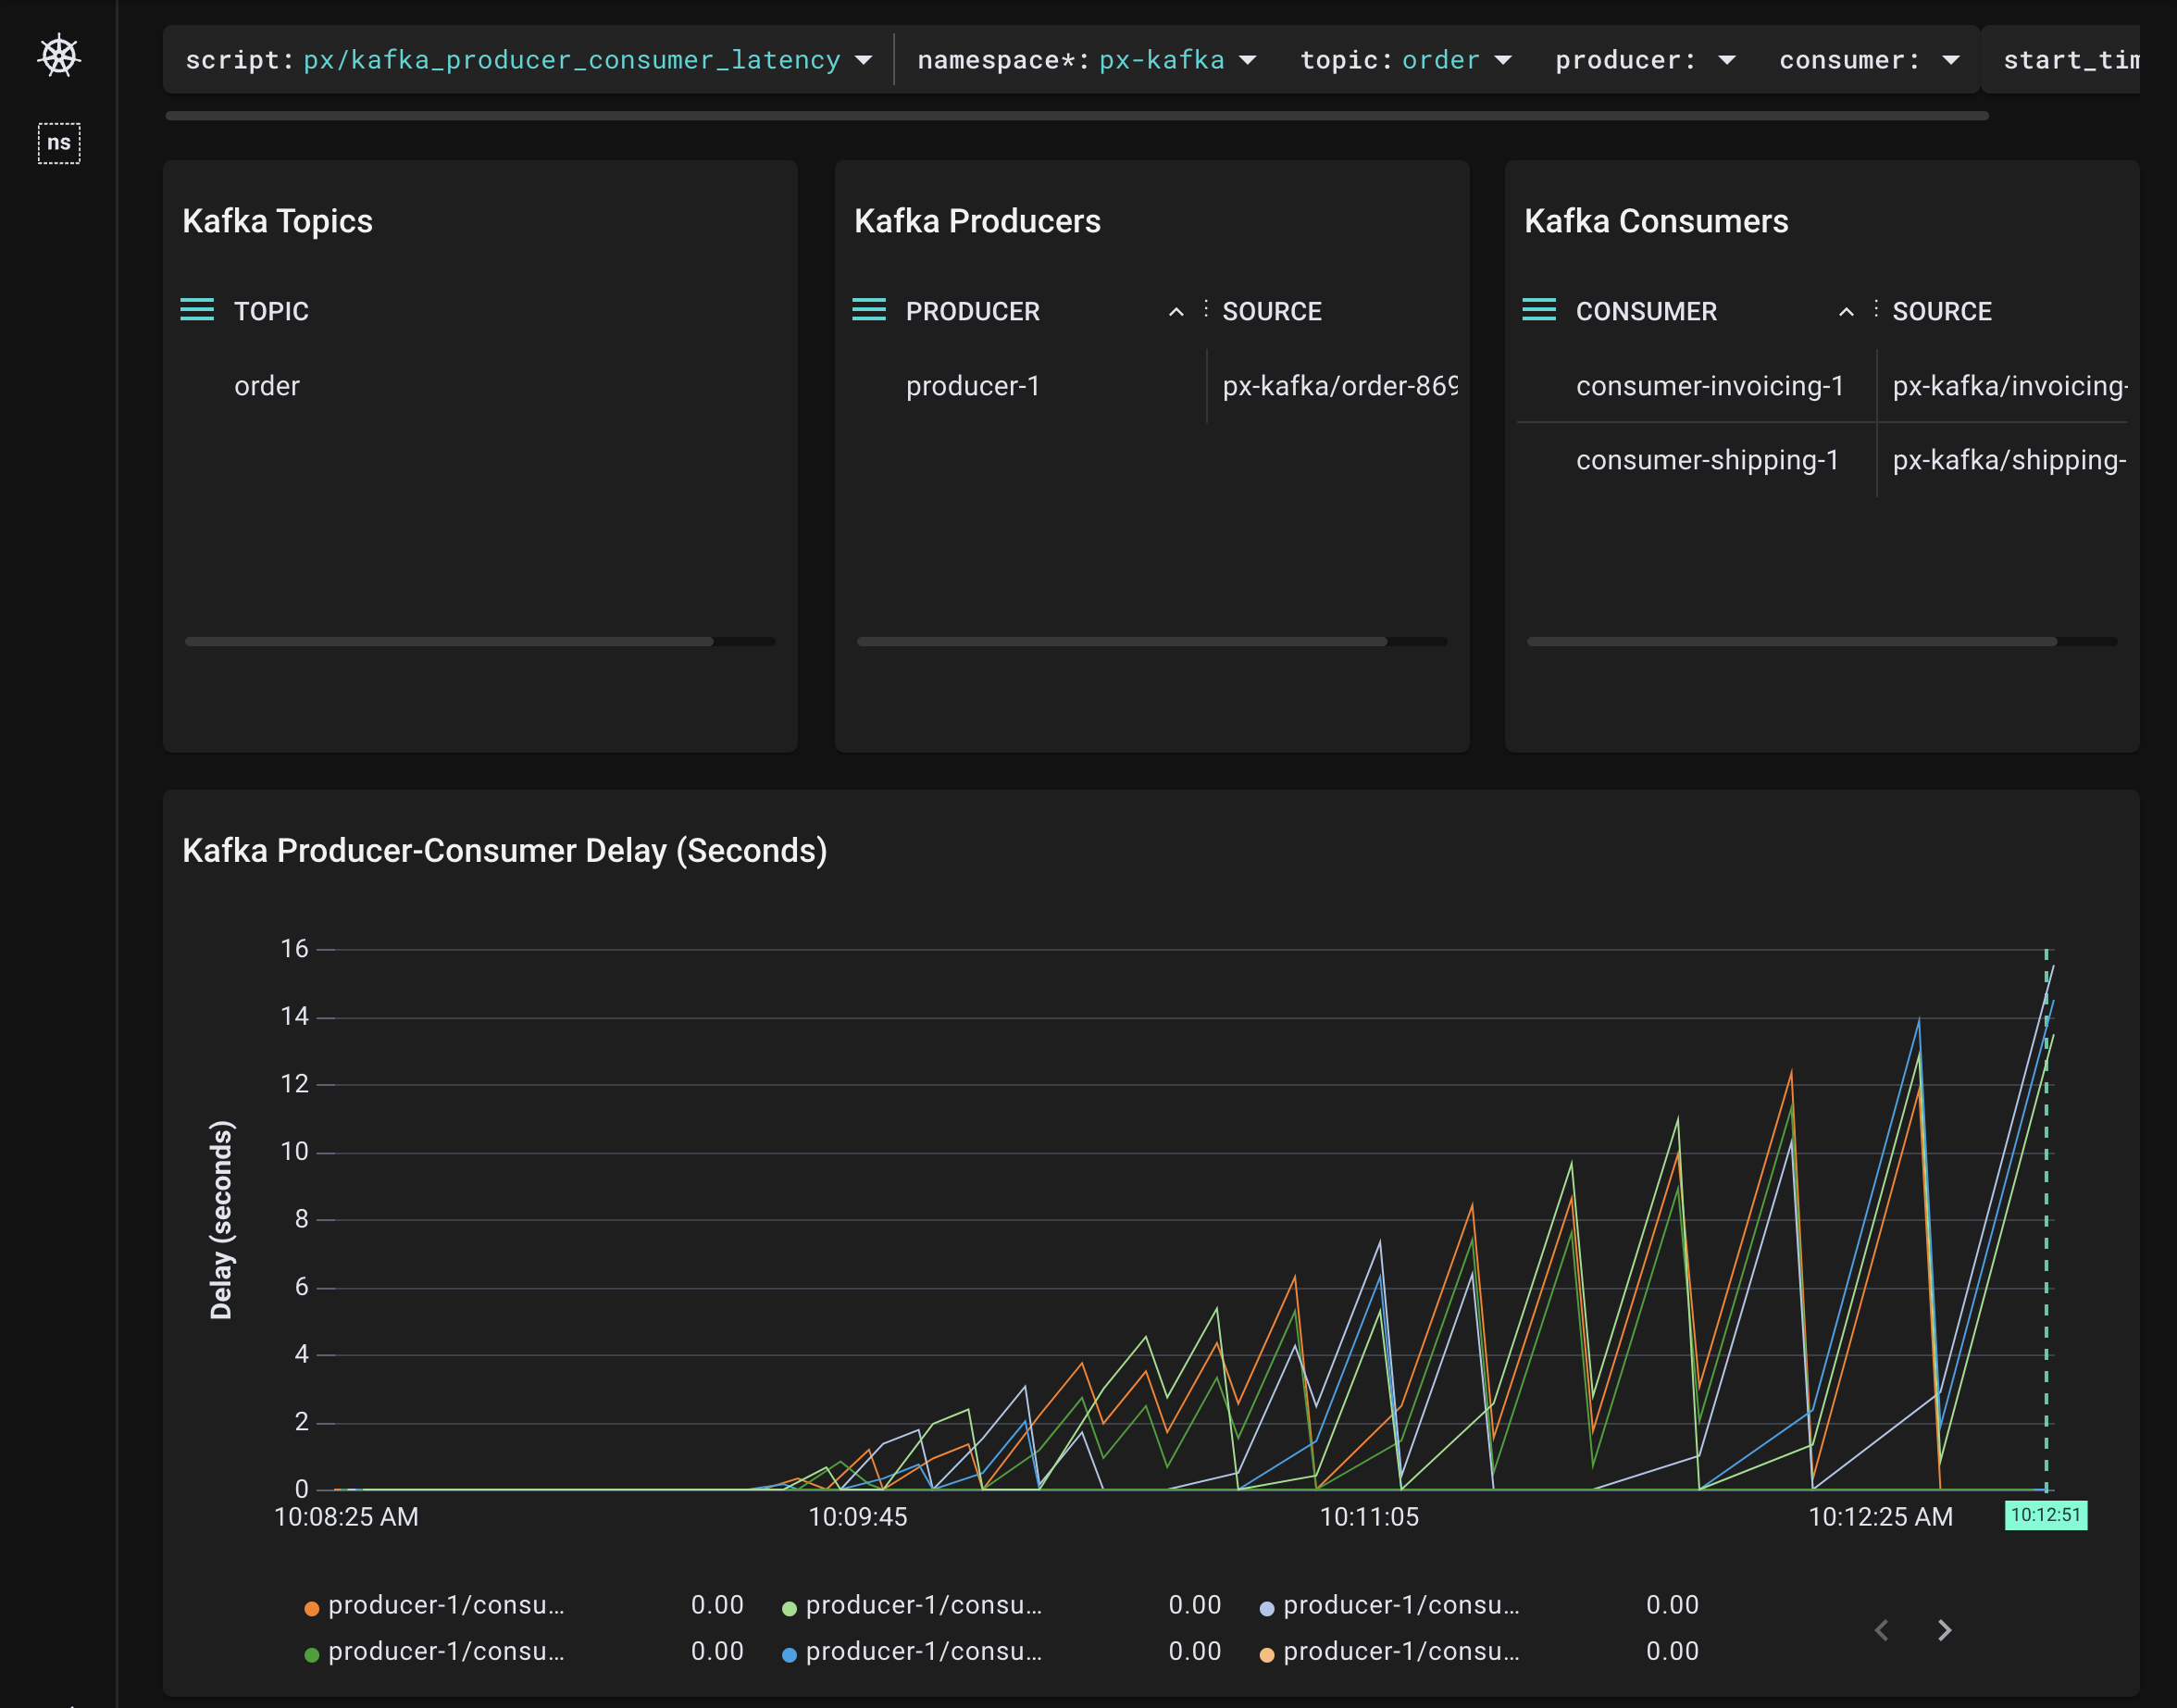
The Kafka Producers and Kafka Consumers tables show us that we have 1 producer and 2 consumers for this topic.
The Kafka Producer-Consumer Delay (Seconds) graph plots the delay between when the producer pushes messages to the
ordertopic and the consumers fetch them.
shipping consumers. Select the drop-down arrow next to the consumer argument, type shipping, and press Enter to re-run the script.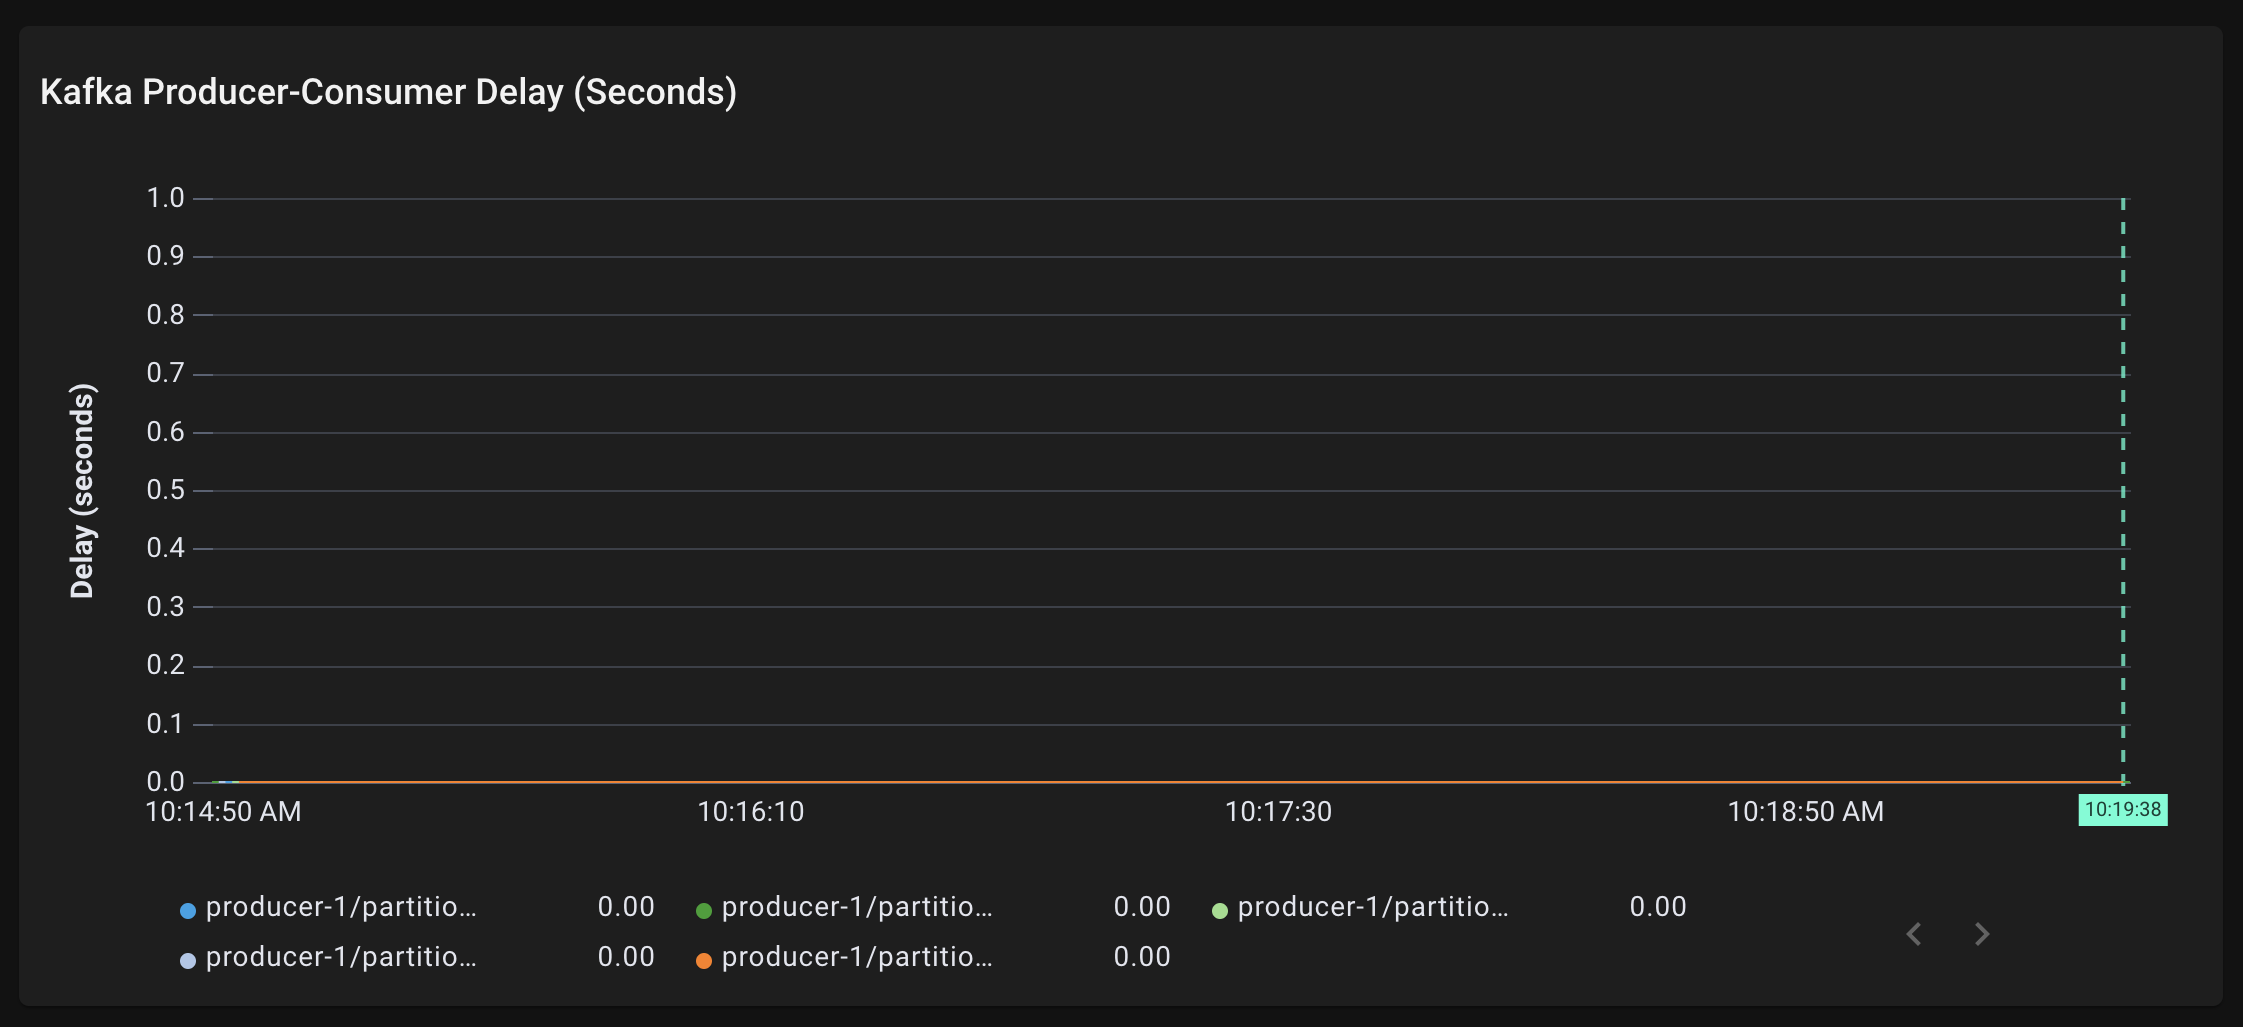
The graph updates to show a flat line. This tells us that there is near zero latency between when the
ordertopic messages are being produced and when all 5shippingpartitions are consuming the messages.
invoicing consumers. Select the drop-down arrow next to the consumer argument, type invoicing, and press Enter to re-run the script.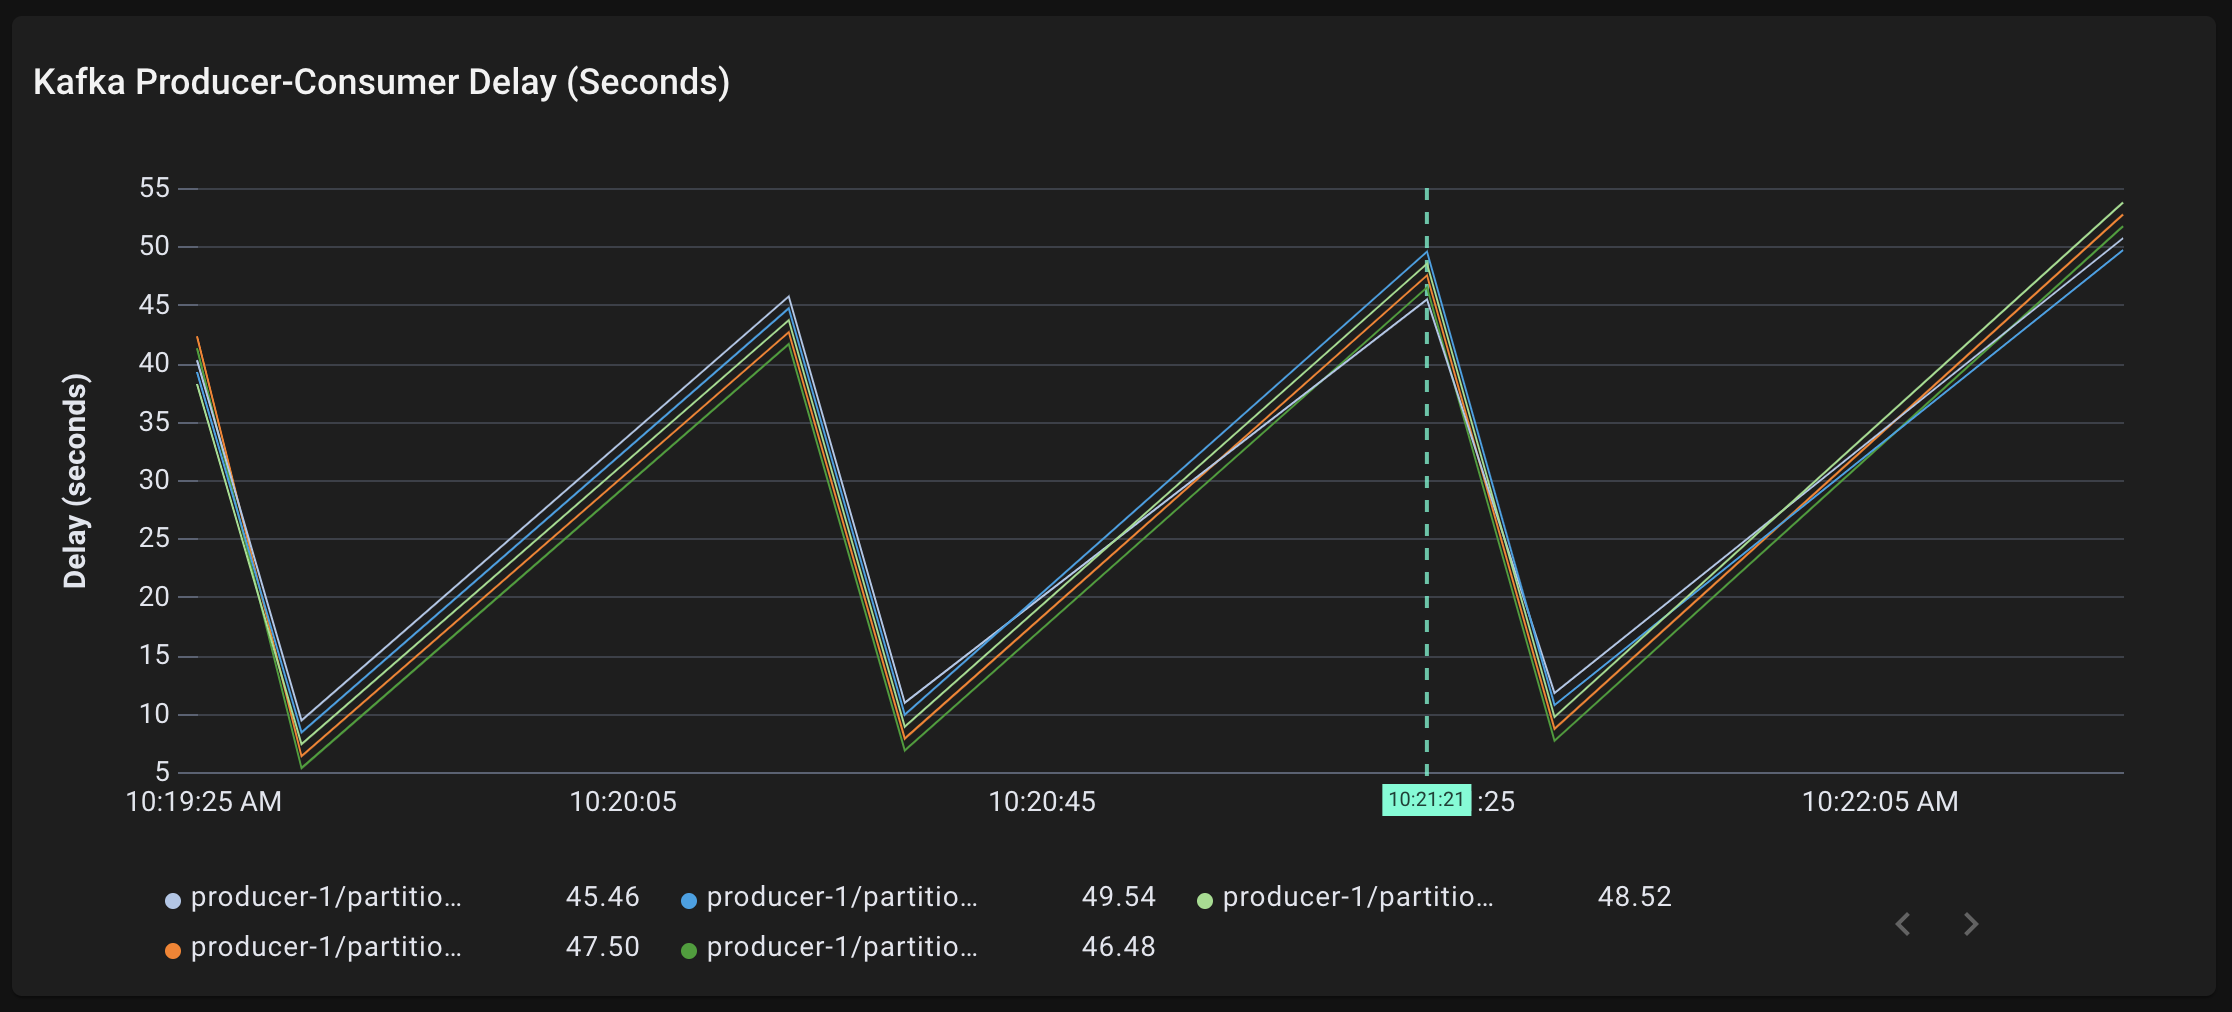
The graph updates to show non-zero latency for all 5
invoicingpartitions. All 5 partitions are consumingordertopic messages around 40-55 seconds after they are being produced.
The zig zag line shape is due to the
invoicingconsumer fetching a batch of messages from the topic, processing these messages slowly, then fetching another group of messages and being even more behind. The overall trend is upward; there is increasing producer-consumer lag for theinvoicingconsumer. This is a bad sign and it could end in data loss or affect the whole cluster if it isn’t addressed.
Consumer rebalancing (shuffling the consumers among partitions) can happen for a variety of reasons, including when a new consumer comes online, an existing consumer goes offline or a broker reboots.
It's important to monitor these events because either some or all of the consumers are stopped from consuming messages when the rebalancing is in progress. If consumer rebalancing events happen too often, this can cause consumers to lag in their consumption of messages.
kubectl scale --replicas=3 deployment shipping -n px-kafka
px/kafka_consumer_rebalancing from the script drop-down menu.This script visualizes the most recent Kafka consumer rebalancing events with their delays.
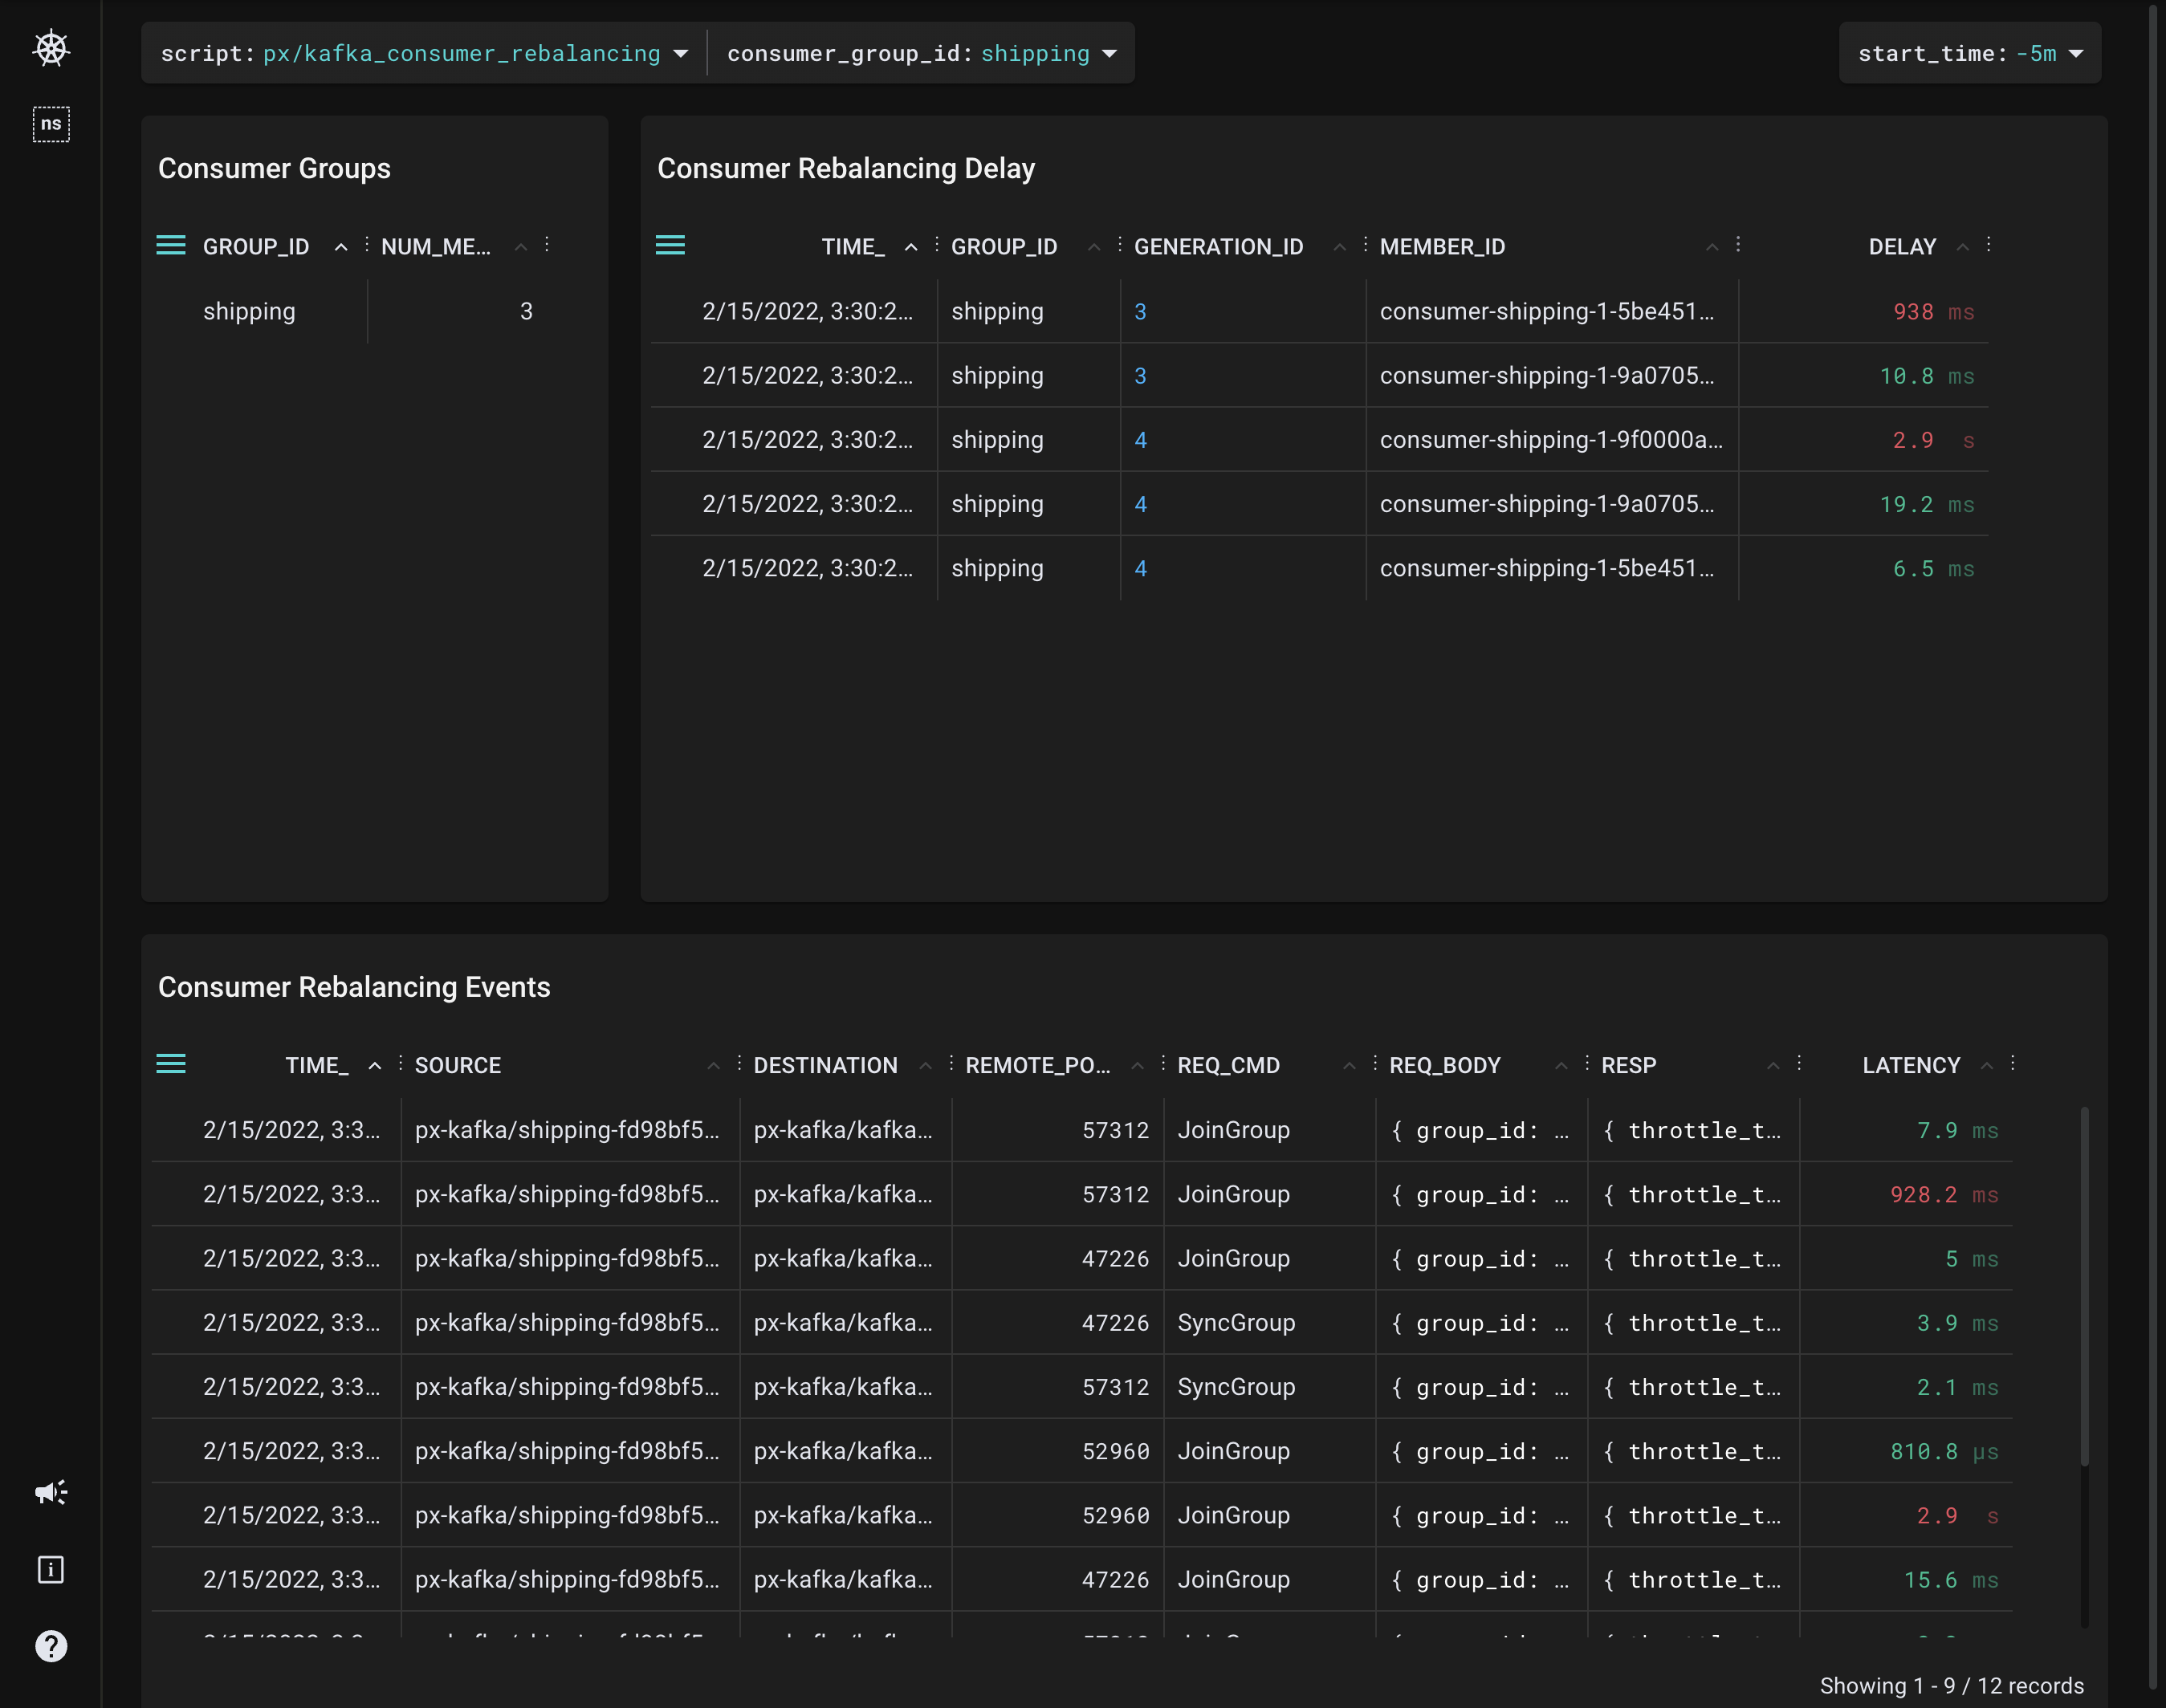
The Consumer Groups table shows us that we now have 3 members in the
shippingconsumer group.
Each consumer rebalancing event consists of 1
JoinGroupand 1SyncGrouprequest per consumer. In the default rebalance protocol, there's a stop-the-world effect on the whole consumer group when a rebalancing event happens.
The Consumer Rebalancing Events table shows the traced
JoinGroupandSyncGrouprequests.
The Consumer Rebalancing Delay table at the top calculates the delay between when the
JoinGrouprequest was sent and when theSyncGrouprequest was received. This measures the stop-the-world delay mentioned above.
This tutorial demonstrated a few of Pixie's community scripts. To learn how to write your own PxL script, check out the tutorial.
